Business Intelligence with Microsoft SQL Server 2008
Business Intelligence
With the advance of technology, organizational data is often already collected in computer database through the use of database management system such as Access, Oracle, SQL Server … etc. Data has to be gathered, modeled and transformed before it can be used to troubleshoot problems, extract useful information, suggest solutions, support decision-making and improve business insight. Furthermore, with an explosion of data stored in computer systems and the demands of an ever-changing world, we need larger, faster solutions that can be created and developed quickly and effectively. This led to a new technology – Business Intelligence (BI which includes reporting, online analytical processing (OLAP), data mining, business performance management, benchmarking and predictive analytics.
Delivery of BI Solution
Some organizations develop sophisticated BI systems to handle their data analysis needs. Business Activity Monitoring (refers to the aggregation, analysis, and presentation of real time information about the activities within the organization) and Competitive Analysis (allows a company to assess the strengths and weaknesses or their competitors) are two of the tools often included in a BI system. Another approach of delivering BI solutions is to integrate BI data into the users’ familiar tools (like Microsoft Office). This provides a familiar interface and an open, embeddable architecture to allow users to integrate the data.
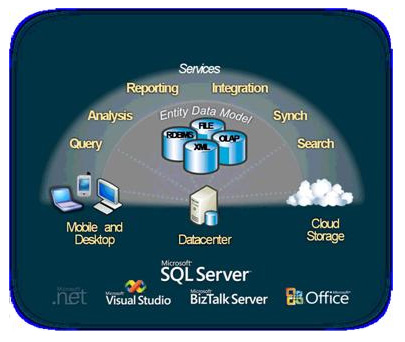
Microsoft SQL Server BI Solution
The BI solution offered by SQL Server consists of three components:
-
Integration Services - integrate data from different data source. Build, manage and deploy integration solutions or populate data warehouse and build a holistic view of business.
-
Reporting Services - report on enterprise-wide data. Create, manage, and deliver server-based reports with interactive views that provide valuable insights.
- Analysis Services - analyze results and provide a consolidated view across all business dimensions as the foundation for all relational, multidimensional, and predictive analysis, enabling deep insight into the key drivers impacting businesses.
Users can use Business Intelligence Development Studio (an IDE which is based on Microsoft Visual Studio development environment) to do data analysis and develop BI solutions by utilizing the Microsoft SQL Server Analysis Services, Reporting Services and Integration Services.
What’s New in SQL Server 2008 in BI
SQL Server 2008 provides a comprehensive and scalable data warehouse platform that enables powerful analyses with a single analytical store. Following are some of the advances in SQL Server 2008 in data warehousing:
Data compression
Data compression built into SQL Server 2008 enables organizations to store data more efficiently, while also improving performance due to lower I/O demands.
Backup compression
With SQL Server 2008 backup compression, less storage is required to keep backups online, and backups run significantly faster since less disk I/O is required.
Resource Governor
Resource Governor allows organizations to define resource limits and priorities for different workloads, which enables concurrent workloads to provide consistent performance.
SQL Server 2008 enables organizations to efficiently deliver reports to users according to their business needs.
New Report Designer
The Report Designer is optimized for creating reports, enabling organizations to accommodate reporting needs. Furthermore, it enables users to edit or update existing reports within an environment optimized for Microsoft Office.
Visual Components
SQL Server 2008 extends the visual components available within reports. Visualization tools such as maps, gauges, and charts make reports more accessible and understandable.
Optimized Office Interoperability
Microsoft Office system provides optimized interoperability with SQL Server 2008 Analysis Services. For example, Excel is a fully functional Analysis Services client; Reporting Services can create reports from Analysis Services data and render them as Microsoft Office Word documents and Microsoft Office Visio can be used to annotate, enhance, and present data mining graphical views.
Microsoft SharePoint Integration
SQL Server 2008 Reporting Services offers integration with Microsoft Office SharePoint Server 2007 and Microsoft SharePoint Services, providing central delivery and management of enterprise reports and other business insights.
Microsoft Office PerformancePoint Server
An integrated performance management application to monitor, analyze, and plan business activities based on the data provided by SQL Server 2008 Analysis Services. Office PerformancePoint Server 2007 provides scorecards, dashboards, management reporting, analytics, planning, budgeting, forecasting, and consolidation functionality to provide extensive performance management capabilities.
SQL Server 2008 builds on the strong OLAP capabilities of SQL Server 2005 by delivering faster query times. SQL Server Analysis Services provides the following analytical advances:
Design to scale
SQL Server 2008 drives broader analysis with enhanced analytical capabilities and with more complex computations and aggregations. New cube design tools help users streamline the development of the analysis infrastructure, enabling them to build solutions for optimized performance. Best Practice Design Alerts have been built into the design, enabling developers to integrate real-time alerts at design time, which optimizes design.
Resource Monitor
A new Resource Monitor in SQL Server 2008 provides detailed insight into resource utilization. With this Resource Monitor, the database administrator can monitor and control the analysis workload to optimize server utilization.
Predictive Analysis
An enhanced Time Series algorithm extends forecasting capabilities in terms of accuracy, stability and prediction flexibility.
Analytical data from Analysis Services can be made available to users by
-
Building UDM (Unified Dimensional Model) - client applications can access data from both the relational and the multidimensional databases in the data warehouse, without using separate models for each
-
Centralizing access and manageability of key enterprise metrics
-
Allowing users to access data mining functionality by installing Microsoft SQL Server Data Mining Add-Ins for Office 2007
-
Using Microsoft Office 2007 to connect Analysis Services
-
Integrating analytical data into the users’ customized client interface by employing Analysis Services server as a provider of web services (through OLE DB for OLAP, ADOMD, and ADOMD.Net)
References